Understanding qualitative test results leads to a simple interpretation of the results
29 Oct 2021Some food chain analyses are performed with qualitative or binary response tests; that is, they provide a positive or negative (compliant or non-compliant) result for a sample, with respect to its limit of detection. Some well -known examples are microbial inhibition tests (Eclipse) or rapid tests (e.g. Proteon, Duplex BT Scan or IC).
Despite the fact that the interpretation of these tests is simple (+/-), sometimes the analyst may find situations that are more difficult to understand. This is the case with samples that contain the analyte at a concentration close to the test detection limit, when the result may be positive or negative if the test is repeated several times.
This is not a reflection on the performance of the test or the quality of the product, but rather due to a universal principle on which multiple events in nature are based (e.g. chemical reactions, freezing and thawing processes, the growth of organisms or the evolution of a pandemic or neuronal transmission). All of these processes, as well as the response of qualitative tests, follow a sigmoidal or “S –shaped” curve model. Understanding this curve helps us to easily understand the response of the tests.
The example below is the response of the Eclipse Farm 4G test for detecting antibiotic residues in milk. This is equally valid for rapid tests, with only the analyte dose on the x-axis having to be changed in the range of its detection limit.
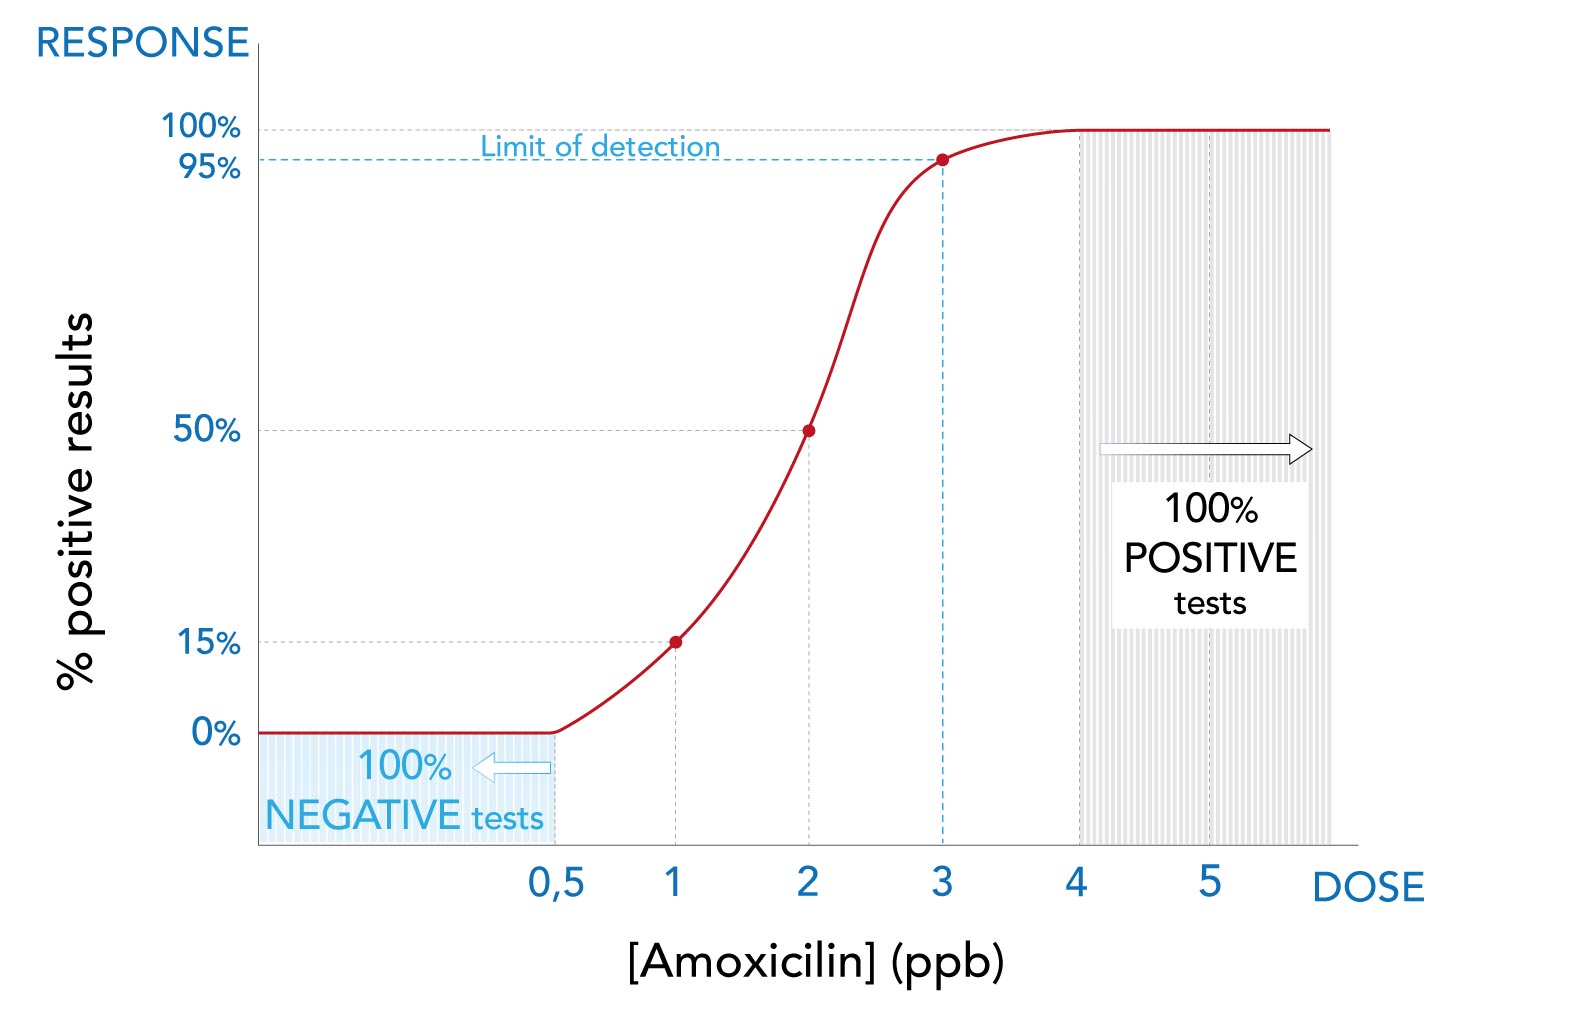
Figure: Graph of the Eclipse test response (positive/negative) with increasing doses of amoxicillin in a milk sample being analysed. The ordinate (y) axis represents the % positive results obtained in the milk sample at a given amoxicillin concentration, represented along the abscissa (x) axis.
After looking at the graph, the following can be concluded:
- All samples with an amoxicillin concentration < 0.5 ppb will give a negative result in all replicates.
- All samples with an amoxicillin concentration > 4 ppb will give a positive result in all replicates.
- For samples in the narrow concentration range of 0.5-4 ppb, the response depends on the dose:
- 15% of samples with 1 ppb of amoxicillin will test positive.
- 50% of samples with 2 ppb of amoxicillin will test positive.
- 95% of samples with 3 ppb of amoxicillin will test positive.
This S-shaped dose-response curve is common in all qualitative trials. Understanding this behaviour, it can be seen why:
- High analyte concentrations (in this example, of amoxicillin) will always give a very clear positive result.
- Very low analyte concentrations (including its absence, i.e. at zero concentration) will always give a very clear negative result.
- At concentrations around the limit of detection (in this example between 0.5 and 4 ppb of amoxicillin) either positive or negative results can be obtained, depending on the analyte dose or concentration.
Another important point is to know how a test detection limit is established. International reference organisations (e.g. AOAC, EU-CRL, IDF) have established that the detection limit is the lowest concentration of the analyte capable of being detected 95% of the time, i.e. with 95% of test repetitions.
Looking at the graph and considering the definition of a test detection limit, it can be seen that:
- The detection limit is designed to give a very high level of security or confidence (95% of the time, i.e. almost all the time). For example, after testing 20 samples at the test detection limit (3 ppb Amoxicillin in the Eclipse test), 19 of them will give a positive result; with 1 sample being negative.
- Analyte values close to the detection limit in its lower range may give either positive or negative results in proportions depending on the analyte dose. For example, samples with 2 ppb will give 50% positive and 50% negative results.
Therefore, from now on, if you analyse a sample several times and all duplicates do NOT give either a positive or negative result, there is a high probability the sample contains the analyte at a concentration at, or just below, the limit of detection.


